Article preview View full access options

Late acquisition of mitochondria by a host with chimaeric prokaryotic ancestry

Journal name:
Nature
Volume:
531,
Pages:
101–104
Date published:
DOI:
doi:10.1038/nature16941
Received
Accepted
Published online

The origin of eukaryotes stands as a major conundrum in biology1. Current evidence indicates that the last eukaryotic common ancestor already possessed many eukaryotic hallmarks, including a complex subcellular organization1, 2, 3. In addition, the lack of evolutionary intermediates challenges the elucidation of the relative order of emergence of eukaryotic traits. Mitochondria are ubiquitous organelles derived from an alphaproteobacterial endosymbiont4. Different hypotheses disagree on whether mitochondria were acquired early or late during eukaryogenesis5. Similarly, the nature and complexity of the receiving host are debated, with models ranging from a simple prokaryotic host to an already complex proto-eukaryote1, 3, 6, 7. Most competing scenarios can be roughly grouped into either mito-early, which consider the driving force of eukaryogenesis to be mitochondrial endosymbiosis into a simple host, or mito-late, which postulate that a significant complexity predated mitochondrial endosymbiosis3. Here we provide evidence for late mitochondrial endosymbiosis. We use phylogenomics to directly test whether proto-mitochondrial proteins were acquired earlier or later than other proteins of the last eukaryotic common ancestor. We find that last eukaryotic common ancestor protein families of alphaproteobacterial ancestry and of mitochondrial localization show the shortest phylogenetic distances to their closest prokaryotic relatives, compared with proteins of different prokaryotic origin or cellular localization. Altogether, our results shed new light on a long-standing question and provide compelling support for the late acquisition of mitochondria into a host that already had a proteome of chimaeric phylogenetic origin. We argue that mitochondrial endosymbiosis was one of the ultimate steps in eukaryogenesis and that it provided the definitive selective advantage to mitochondria-bearing eukaryotes over less complex forms.

At a glance

Figures

left
  1. Stem length analysis.
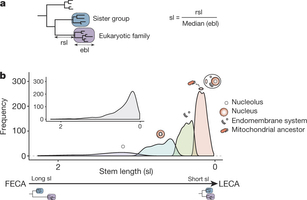
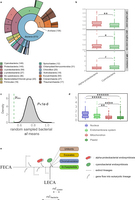
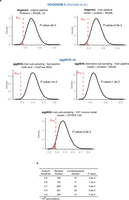
    Figure 1: Stem length analysis.

    a, Schematic representation of the inference of the phylogenetic origin of LECA groups and the measured phylogenetic distances. First monophyletic groups of eukaryotic proteins that passed the required thresholds were considered as protein families present in LECA (purple box). The taxonomic range of the proteins present in the closest neighbouring tree partition (sister group, blue box) was used to define the putative phylogenetic origin of the LECA family. Distance to the common ancestor with the closest prokaryotic neighbouring group was measured (raw stem length, rsl) and normalized (stem length, sl) by dividing it by the median of the distances from the eukaryotic terminal nodes to the last common ancestor of all eukaryotic sequences (eukaryotic branch length, ebl). b, Subpopulation distributions within the overall stem length distribution (inset) as defined by a mixture model and the expectation-maximization algorithm. The four subpopulations/components are over-represented in different prokaryotic phylogenetic groups of origin, Gene Ontology (GO) and clusters of orthologous groups (COGs) functional category annotations (see text, Table 1 and Supplementary Tables 1 and 2). On top of these components, we represent the cellular localizations for which each family class is enriched. FECA, first eukaryotic common ancestor.

  2. Phylogenetic distance profiles.
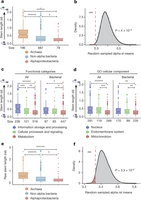
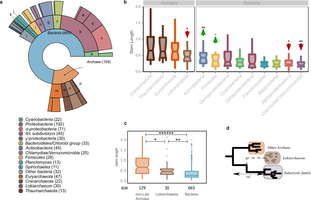
    Figure 2: Phylogenetic distance profiles.

    ad, Profiles of different prokaryotic sources (a, b), cellular functions (c) and cellular components (d). The lower and upper box limits in a, c and d correspond to the first and third quartiles (25th and 75th percentiles). a, Box plot comparing stem length distributions in LECA families with archaeal, non-alpha bacterial and alphaproteobacterial sister-groups. Numbers on the x axis indicate the number of families included in each class. Symbols indicate the P values obtained from a two-sided Mann–Whitney U-test for the indicated comparisons as follows: *P ≤ 5 × 10−2; **P ≤ 1 × 10−2; ***P ≤ 1 × 10−3; ******P < 1 × 10−6. b, The observed mean (μobs) stem length of alphaproteobacterial values compared with the random sampling distribution of means, under the null hypothesis that families of different bacterial origins do not show differences in stem lengths. The P value is the probability that the mean would be at least as extreme as the observed, if the null hypothesis were true. The dashed line and the shaded area under the density plot correspond to the one-sided P value of the test (indicated next to the figure). c, d, Box plots of stem length distributions in LECA families of different COG functional categories (c) and GO localizations (d), when considering all LECA families (All), or only those of bacterial descent (Bacterial). Other symbols as in a. e, f, The results obtained in a and b are consistent when using raw stem lengths, indicating that the relative differences in stem lengths are not driven by differences in the rates of evolution within extant eukaryotes (ebl).

  3. Correspondence of different LECA components with different cellular localizations and functions.
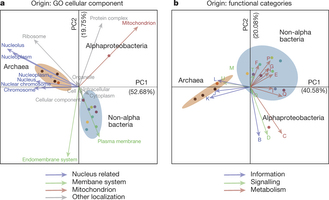
    Figure 3: Correspondence of different LECA components with different cellular localizations and functions.

    a, b, Correspondence analysis symmetrical biplots showing differences between the localizations (a) and functions (b) of the families of various phylogenetic origins. In both cases, the first principal components, accounting for the largest percentage of variance explained, clearly separate the bacterial and archaeal (brown ellipse) eukaryotic origins, while the second components separate the alphaproteobacterial (red dot) from the other bacterial origins (cyan ellipse). The numbers next to the principal axes (PC1, PC2) show the percentage of the total variance explained by each component. Both columns (functions or localizations) and rows (phylogenetic origins) are in principal coordinates. The colours of the arrows, cellular localizations (left) and functional categories (right) correspond to the categories and localizations of Fig. 2c, d accordingly (see Methods). If a term cannot be categorized as above, the colour is grey. Dots are coloured according to the phylogenetic origin of the group as in Extended Data Fig. 1a (see also extended version of this in Extended Data Fig. 8).

  4. Sister group distribution and extended phylogenetic distance profiles.
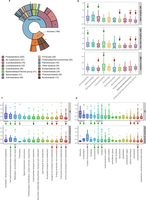
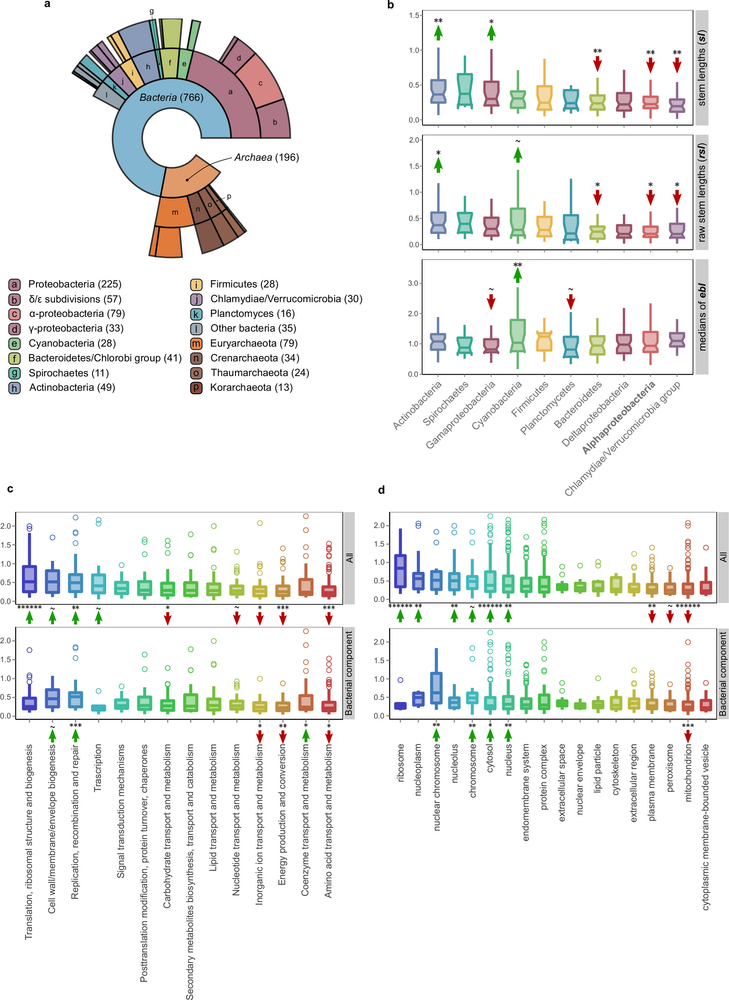
    Extended Data Fig. 1: Sister group distribution and extended phylogenetic distance profiles.

    a, Ring plot showing the distribution of inferred prokaryotic origins. Inner layers represent hierarchically lower (broader) taxonomic levels. The number of LECA families assigned to each group is indicated in parentheses next to the corresponding level in the ring plot or in the boxes below. b, Box plot showing the distributions of branch lengths in the different bacterial components. Measured stem lengths (sl), raw stem lengths (rsl), and the medians of the lengths from LECA to branch tips inside the eukaryotic families (ebl), as defined in Fig. 1a, are shown. Permutation tests were performed to evaluate the statistical significance of the differences between the distributions. A total of 106 permutations were performed, with the values being randomly shuffled in each permutation (see also Methods). The arrows and symbols above the boxes refer to the statistical significance of the differences observed compared with randomly shuffled distributions (lower values, downward red arrow; higher values, upward green arrow). The correspondence between the symbols and the P values is as follows: ~P ≤ 1 × 10−1; *P ≤ 5 × 10−2; **P ≤ 1 × 10−2; ***P ≤ 1 × 10−3; ******P < 1 × 10−6. The lower and upper box limits correspond to the first and third quartiles (the 25th and 75th percentiles). c, d, Stem length profiles of the various functional categories (c) and GO slim cellular components (d) are shown. As in Fig. 2c, the stem lengths are also evaluated by looking only at the bacterial component to exclude the possibility that the observed differences are due solely to archaeal–bacterial differences. The significance was assessed with permutation tests (106 permutations) and is indicated with arrows as in b.

  5. Families of archaeal origin have significantly longer stems than families of bacterial origin across different functional categories, similar selective pressures, and connectivities/expression levels.
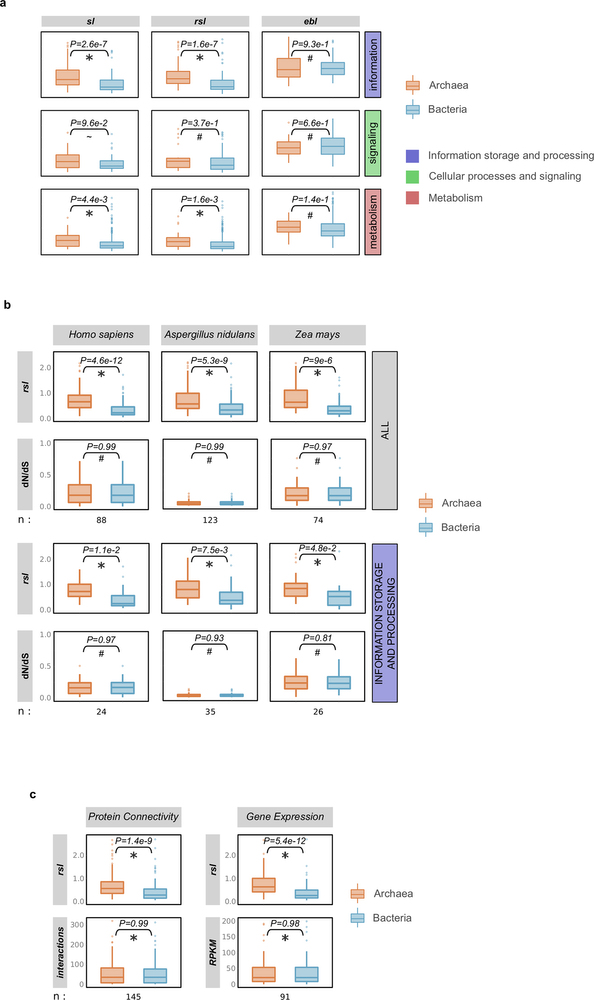
    Extended Data Fig. 2: Families of archaeal origin have significantly longer stems than families of bacterial origin across different functional categories, similar selective pressures, and connectivities/expression levels.

    a, The stem lengths, raw stem lengths, and eukaryotic branch lengths, between families of archaeal and bacterial inferred origin, are compared across the three major functional categories. While the eukaryotic branch lengths among the groups do not show significant differences, differences are detected in their respective stems (raw stem lengths and stem lengths). b, Archaeal and bacterial LECA families of similar selective pressures (as measured by dN/dS values across family members) differ significantly in terms of their raw stem lengths. Sets of families from both groups were matched with respect to their dN/dS values in the indicated reference species. The dN/dS data were downloaded from Ensembl for family members corresponding to Homo sapiens (Metazoa), Aspergillus nidulans (fungi) and Zea mays (plants) (see Supplementary Information section 1). The comparison of the raw stem lengths of the two sets shows that archaeal families generally have significantly longer stems (upper plots), and functions within the ‘information storage and processing’ category (lower plots), irrespective of their selective pressures. c, Archaeal and bacterial LECA families of similar connectivity/expression levels show significantly different raw stem lengths (see Supplementary Information section 1). In ac, differences between the archaeal and bacterial component were evaluated with a two-tailed Mann–Whitney U-test and the P value is indicated in each case (*P ≤ 5 × 10−2; ~ P ≤ 1 × 10−1; #P > 1).

  6. Analysis of the cyanobacterial signal in primary plastid-bearing eukaryotes.
    Extended Data Fig. 3: Analysis of the cyanobacterial signal in primary plastid-bearing eukaryotes.

    a, Ring plot showing the distribution of inferred prokaryotic origins in widespread plant protein families, as in Extended Data Fig. 1a. The profile of inferred origins of eukaryotes that acquired a plastid through primary endosymbiosis carries a strong signal from the cyanobacterial endosymbiont. b, c, Families of inferred cyanobacterial origin have significantly shorter stem lengths and raw stem lengths than alphaproteobacterial families (b) and than the random distribution of stem lengths from the bacteria inferred component (c), pointing to a more recent acquisition of plastids (post-LECA). d, Overall, as with mitochondrial localized proteins, those proteins localized to plastids have shorter stems than the nuclear and endomembrane system proteins. e, Schematic representation of the expected difference in stems, given that cyanobacterial endosymbiosis occurred after the diversification of the major eukaryotic lineages. As confirmed, the raw stem lengths measured from plant protein families to their common ancestor with cyanobacteria are shorter than those whose origin can be traced back to Alphaproteobacteria or other bacterial groups. Two-tailed Mann–Whitney U-test P value symbols in b and d are as in Extended Data Fig. 1; additionally ****P ≤ 1 × 10−4; *****P ≤ 1 × 10−5.

  7. Effect of alternative LECA definitions.
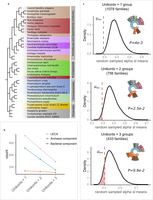
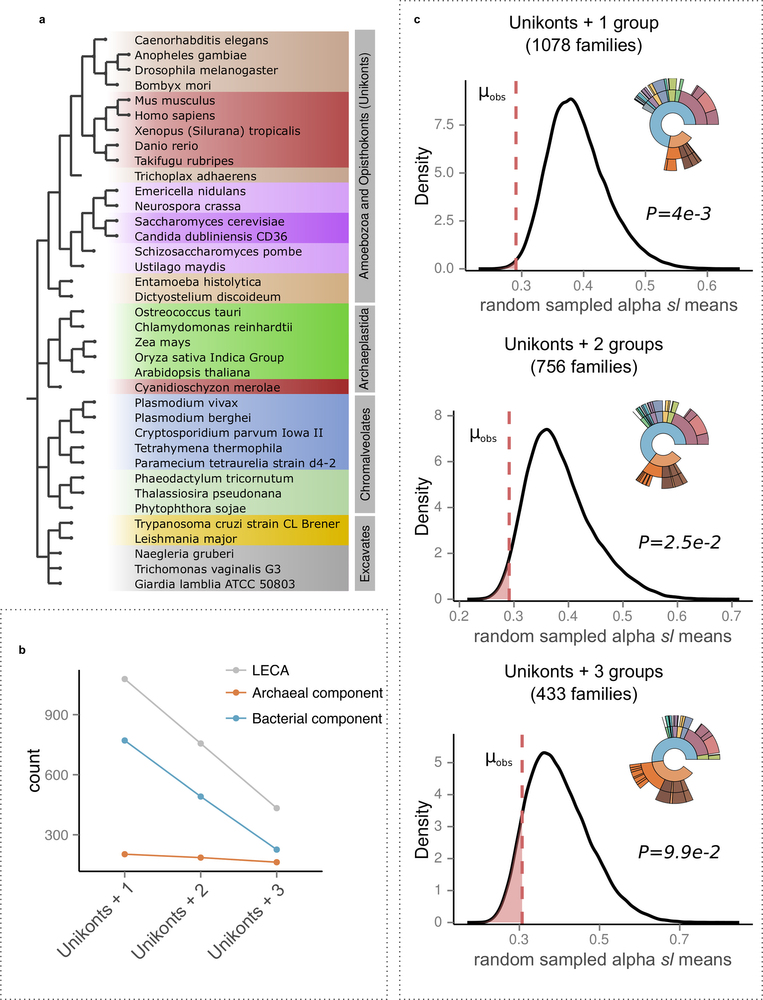
    Extended Data Fig. 4: Effect of alternative LECA definitions.

    a, The four eukaryotic groups including all 37 selected eukaryotic species used in the analysis are shown next to the NCBI taxonomic structure, with the higher groupings modified according to the Tree of Life Project (http://tolweb.org/Eukaryotes/3). b, Stricter LECA definitions have a much larger effect on the bacterial component than on the archaeal component, which is more widespread among eukaryotic groups. c, The effect of different LECA definitions in terms of taxonomic assignments and differences in stem lengths between proteins of alphaproteobacterial origins and those derived from other bacteria. Numbers in parenthesis indicate the total number of LECA families that passed the threshold. The kernel density plots, as in Fig. 2b, show the observed stem length means for Alphaproteobacteria compared with 106 random samplings among values in protein families of bacterial origin. The observed means (μobs) are shown with a dashed red line, reflecting the P value of each test, and indicated next to the plot. See also Supplementary Information section 3.1.

  8. Alphaproteobacterial-derived proteins have consistently shorter branches, irrespective of the methods, data sets, and support thresholds.
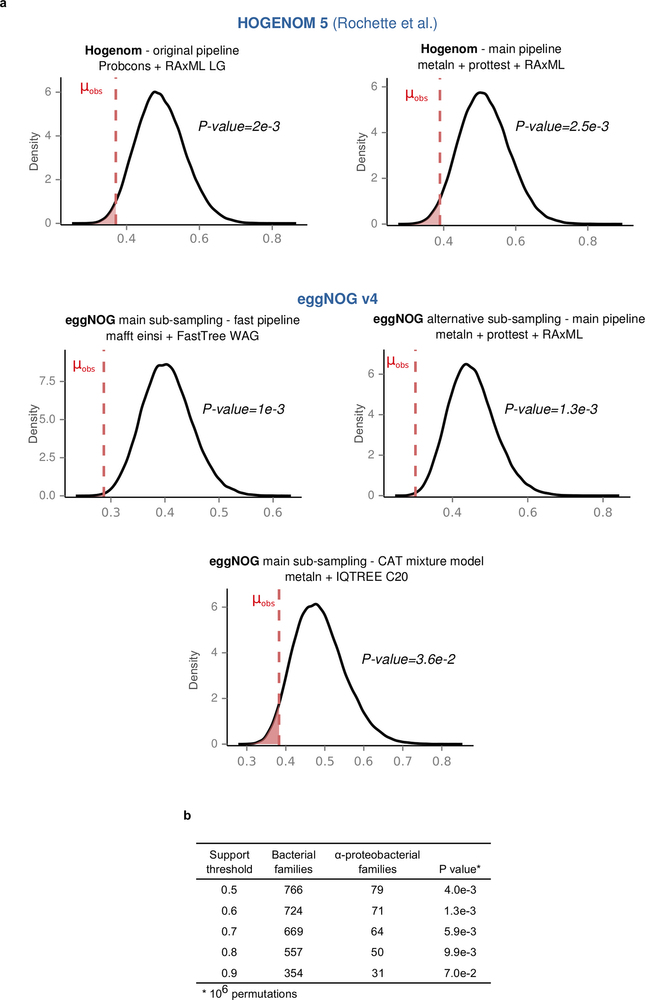
    Extended Data Fig. 5: Alphaproteobacterial-derived proteins have consistently shorter branches, irrespective of the methods, data sets, and support thresholds.

    Kernel density plots of the random mean distributions of the stem lengths are shown for the different methods, data sets and support thresholds used (see also Supplementary Information sections 3.2 and 3.3). The observed alphaproteobacterial means (μobs) are as in Fig. 2b. a, Results after using either the phylogenetic trees provided by the authors in ref. 8 (upper left), our standard phylogenetic pipeline applied to their sampling of sequences (upper right) or alternative phylogenetic pipelines or samplings from EggNOG (lower). b, The main result is robust against progressively stricter support thresholds until the sample size becomes too small (support threshold > 0.9). Numbers in parenthesis indicate the number of bacteria-inferred LECA families for each threshold.

  9. Evaluation of alternative HGT scenarios and other potential biases.
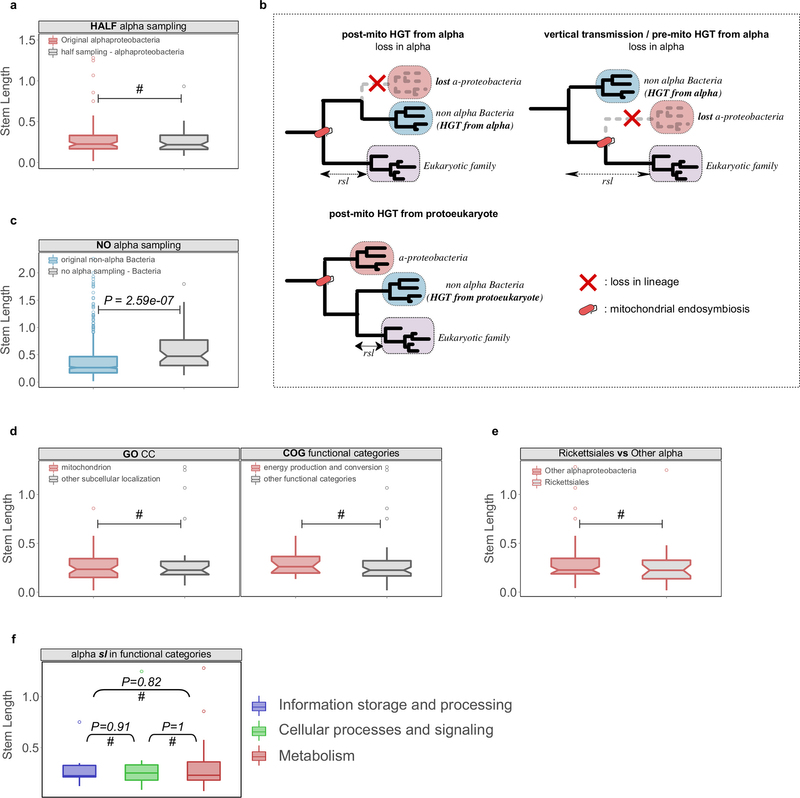
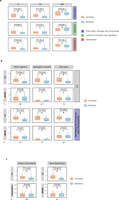
    Extended Data Fig. 6: Evaluation of alternative HGT scenarios and other potential biases.

    a, The sampling effect was simulated by artificially removing part or all of the alphaproteobacterial sequences in the final data sets. To simulate the potential bias caused by an enriched sampling of Alphaproteobacteria, an artificial reduction of alphaproteobacterial sequences to 50% was applied to the data set (‘HALF alpha sampling’). The reduction of alphaproteobacterial sequences by 50% does not significantly change the inferred stem length within families of alphaproteobacterial origin. #Cases where the difference was not significant. b, Different scenarios of HGT to the proto-mitochondrion are unable to explain the observed signal in families mapped to non-alpha Bacteria. The transfer of a gene from Alphaproteobacteria to another bacterial lineage after mitochondrial endosymbiosis and its parallel loss from the lineage of the mitochondrial ancestor (‘post-mito HGT from alpha’) would result in unchanged stem lengths. Loss of a gene from the alphaproteobacterial sister clade would result in an increase of the inferred stem lengths (‘vertical transmission/pre-mito HGT from alpha’). The transfer of a gene from the protoeukaryotic lineage to other bacterial clades would result in shorter stem lengths compared with the alphaproteobacterial mappings (‘post-mito HGT from protoeukaryote’). c, Upon total exclusion of alphaproteobacterial sequences (‘NO alpha sampling’), eukaryotic families map to other bacterial groups but with stem length higher than those observed typically. The same is observed when comparing the stem lengths of the families mapping to proteobacterial groups in the absence of Alphaproteobacteria with those typically mapping to proteobacterial groups other than Alphaproteobacteria. d, Box plots showing that there are no significant differences in the stem lengths between alphaproteobacterial families with mitochondrial localization compared with those with other subcellular localizations (left), or between families involved in energy-related functions compared with those involved in other functional categories (right). e, Box plot showing no significant difference between the distribution of stem lengths of families of Rickettsiales-inferred origin and other Alphaproteobacteria. f, Alphaproteobacterial families in different functional categories show no difference in stem lengths. In all cases the distributions were compared using a two-sided Mann–Whitney U-test. See also Supplementary Information sections 4 and 5.

  10. LECA inference and Lokiarchaeota.
    Extended Data Fig. 7: LECA inference and Lokiarchaeota.

    Results after the inclusion of Lokiarchaeota in our analysis. a, The distribution of the sister group inference among prokaryotic taxonomy is shown in a ring plot together with the number of families in each group in parentheses (as in Extended Data Fig. 1). b, Box plot showing the stem length profiles of the various prokaryotic groups. Lokiarchaeota show the lowest values among all archaeal groups but higher values than any bacterial group. The symbols correspond to the same P values explained in Extended Data Fig. 1 after applying a permutation test (106 permutations) for the archaeal and bacterial components, independently. c, Box plot with the comparison between the non-Loki archaeal, the Lokiarchaeota and the bacterial stem length profiles. The P value symbols are as before (two-sided Mann–Whitney U-test, correction for false discovery rate). d, Schematic representation of the effect of the absence of Lokiarchaeum sequences on the stem lengths. The inferred origin of 30 eukaryotic families that were previously mapped to other, mainly archaeal, groups within the eggNOG version 4 database, is Lokiarchaeota, when homologous sequences from this metagenome are included. A reduction in the observed stem lengths of the families of Lokiarchaeota-inferred origin is expected in the scenario of Lokiarchaeota being the closest known archaeal relative of Eukaryotes. See also Supplementary Information section 6.

  11. Correspondence of different LECA components with different cellular localizations and functions (extended version of Fig. 3).
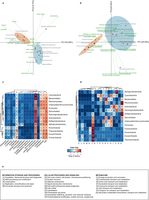
    Extended Data Fig. 8: Correspondence of different LECA components with different cellular localizations and functions (extended version of Fig. 3).

    ad, Different LECA components have different GO cellular components (a, c) and functional (b, d) profiles. Genes of different origin tend to have different functions and subcellular localizations. a, b, The same correspondence analysis symmetrical biplots as in Fig. 3 in higher resolution, with the names of the taxonomic group, the function and the GO slim terms indicated next to the coordinates. The percentage of variance explained by each principal component is indicated next to each axis in parentheses. c, d, The contingency tables also used in correspondence analysis are shown in the form of a heatmap. The asterisks in the different cells reflect the significance of the association between a given origin and a localization (c) or function (d), as computed using permutation tests (106 permutations), where the annotations among each eukaryotic family were reshuffled (see Methods). The correspondence between the symbols and the P values is as in Extended Data Figs 1 and 3. e, The COG functional categories, as organized in the three major groups ‘information storage and processing’, ‘cellular processes and signalling’ and ‘metabolism’.

right

References

  1. Koonin, E. V. The origin and early evolution of eukaryotes in the light of phylogenomics. Genome Biol. 11, 209 (2010)
  2. Embley, T. M. & Martin, W. Eukaryotic evolution, changes and challenges. Nature 440, 623630 (2006)
  3. Koumandou, V. L. et al. Molecular paleontology and complexity in the last eukaryotic common ancestor. Crit. Rev. Biochem. Mol. Biol. 48, 373396 (2013)
  4. Gray, M. W., Burger, G. & Lang, B. F. Mitochondrial evolution. Science 283, 14761481 (1999)
  5. Poole, A. M. & Gribaldo, S. Eukaryotic origins: how and when was the mitochondrion acquired? Cold Spring Harb. Perspect. Biol. 6, a015990 (2014)
  6. Martijn, J. & Ettema, T. J. G. From archaeon to eukaryote: the evolutionary dark ages of the eukaryotic cell. Biochem. Soc. Trans. 41, 451457 (2013)
  7. Lester, L., Meade, A. & Pagel, M. The slow road to the eukaryotic genome. BioEssays 28, 5764 (2006)
  8. Rochette, N. C., Brochier-Armanet, C. & Gouy, M. Phylogenomic test of the hypotheses for the evolutionary origin of eukaryotes. Mol. Biol. Evol. 31, 832845 (2014)
  9. Thiergart, T., Landan, G., Schenk, M., Dagan, T. & Martin, W. F. An evolutionary network of genes present in the eukaryote common ancestor polls genomes on eukaryotic and mitochondrial origin. Genome Biol. Evol. 4, 466485 (2012)
  10. Ku, C. et al. Endosymbiotic gene transfer from prokaryotic pangenomes: inherited chimerism in eukaryotes. Proc. Natl Acad. Sci. USA 112, 1013910146 (2015)
  11. Spang, A. et al. Complex archaea that bridge the gap between prokaryotes and eukaryotes. Nature 521, 173179 (2015)
  12. Do, C. B. & Batzoglou, S. What is the expectation maximization algorithm? Nature Biotechnol. 26, 897899 (2008)
  13. Esser, C. et al. A genome phylogeny for mitochondria among alpha-proteobacteria and a predominantly eubacterial ancestry of yeast nuclear genes. Mol. Biol. Evol. 21, 16431660 (2004)
  14. Gabaldón, T. & Huynen, M. A. Shaping the mitochondrial proteome. Biochim. Biophys. Acta 1659, 212220 (2004)
  15. Koonin, E. V. & Yutin, N. The dispersed archaeal eukaryome and the complex archaeal ancestor of eukaryotes. Cold Spring Harb. Perspect. Biol . 6, a016188 (2014)
  16. Powell, S. et al. eggNOG v4.0: nested orthology inference across 3686 organisms. Nucleic Acids Res. 42, D231D239 (2014)
  17. Katoh, K. & Toh, H. Recent developments in the MAFFT multiple sequence alignment program. Brief. Bioinform. 9, 286298 (2008)
  18. Capella-Gutiérrez, S., Silla-Martínez, J. M. & Gabaldón, T. trimAl: a tool for automated alignment trimming in large-scale phylogenetic analyses. Bioinformatics 25, 19721973 (2009)
  19. Price, M. N., Dehal, P. S. & Arkin, A. P. FastTree 2 – approximately maximum-likelihood trees for large alignments. PLoS ONE 5, e9490 (2010)
  20. Gabaldón, T. & Koonin, E. V. Functional and evolutionary implications of gene orthology. Nature Rev. Genet. 14, 360366 (2013)
  21. Huerta-Cepas, J. et al. PhylomeDB v3.0: an expanding repository of genome-wide collections of trees, alignments and phylogeny-based orthology and paralogy predictions. Nucleic Acids Res. 39, D556D560 (2011)
  22. Edgar, R. C. MUSCLE: multiple sequence alignment with high accuracy and high throughput. Nucleic Acids Res. 32, 17921797 (2004)
  23. Subramanian, A. R., Kaufmann, M. & Morgenstern, B. DIALIGN-TX: greedy and progressive approaches for segment-based multiple sequence alignment. Algorithms Mol. Biol. 3, 6 (2008)
  24. Wallace, I. M., O’Sullivan, O., Higgins, D. G. & Notredame, C. M-Coffee: combining multiple sequence alignment methods with T-Coffee. Nucleic Acids Res. 34, 16921699 (2006)
  25. Darriba, D., Taboada, G. L., Doallo, R. & Posada, D. ProtTest 3: fast selection of best-fit models of protein evolution. Bioinformatics 27, 11641165 (2011)
  26. Stamatakis, A. RAxML version 8: a tool for phylogenetic analysis and post-analysis of large phylogenies. Bioinformatics 30, 13121313 (2014)
  27. Huerta-Cepas, J., Dopazo, J. & Gabaldón, T. ETE: a python Environment for Tree Exploration. BMC Bioinformatics 11, 24 (2010)
  28. Keeling, P. J. The number, speed, and impact of plastid endosymbioses in eukaryotic evolution. Annu. Rev. Plant Biol. 64, 583607 (2013)
  29. Fraley, C., Raftery, A. E., Murphy, T. B. & Scrucca, L. mclust Version 4 for R: Normal Mixture Modeling for Model-Based Clustering, Classification, and Density Estimation. Technical Report No. 597 (Department of Statistics, Univ. Washington, 2012)
  30. Greenacre, M. Correspondence Analysis in Practice (Chapman & Hall, 2007)

Download references

Author information

Affiliations

  1. Bioinformatics and Genomics Programme, Centre for Genomic Regulation (CRG), Carrer del Dr Aiguader, 88, 08003 Barcelona, Spain

    • Alexandros A. Pittis &
    • Toni Gabaldón
  2. Departament of Ciències Experimentals I de La Salut, Universitat Pompeu Fabra (UPF), 08003 Barcelona, Spain

    • Alexandros A. Pittis &
    • Toni Gabaldón
  3. Institució Catalana de Recerca i Estudis Avançats (ICREA), Passeig de Lluís Companys 23, 08010 Barcelona, Spain

    • Toni Gabaldón

Contributions

A.A.P. and T.G. conceived the study. A.A.P. performed the computational analyses. A.A.P. and T.G. analysed and interpreted the data. A.A.P. and T.G. wrote the manuscript.

Competing financial interests

The authors declare no competing financial interests.

Corresponding author

Correspondence to:

Author details

Extended data figures and tables

Extended Data Figures

  1. Extended Data Figure 1: Sister group distribution and extended phylogenetic distance profiles. (500 KB)

    a, Ring plot showing the distribution of inferred prokaryotic origins. Inner layers represent hierarchically lower (broader) taxonomic levels. The number of LECA families assigned to each group is indicated in parentheses next to the corresponding level in the ring plot or in the boxes below. b, Box plot showing the distributions of branch lengths in the different bacterial components. Measured stem lengths (sl), raw stem lengths (rsl), and the medians of the lengths from LECA to branch tips inside the eukaryotic families (ebl), as defined in Fig. 1a, are shown. Permutation tests were performed to evaluate the statistical significance of the differences between the distributions. A total of 106 permutations were performed, with the values being randomly shuffled in each permutation (see also Methods). The arrows and symbols above the boxes refer to the statistical significance of the differences observed compared with randomly shuffled distributions (lower values, downward red arrow; higher values, upward green arrow). The correspondence between the symbols and the P values is as follows: ~P ≤ 1 × 10−1; *P ≤ 5 × 10−2; **P ≤ 1 × 10−2; ***P ≤ 1 × 10−3; ******P < 1 × 10−6. The lower and upper box limits correspond to the first and third quartiles (the 25th and 75th percentiles). c, d, Stem length profiles of the various functional categories (c) and GO slim cellular components (d) are shown. As in Fig. 2c, the stem lengths are also evaluated by looking only at the bacterial component to exclude the possibility that the observed differences are due solely to archaeal–bacterial differences. The significance was assessed with permutation tests (106 permutations) and is indicated with arrows as in b.

  2. Extended Data Figure 2: Families of archaeal origin have significantly longer stems than families of bacterial origin across different functional categories, similar selective pressures, and connectivities/expression levels. (333 KB)

    a, The stem lengths, raw stem lengths, and eukaryotic branch lengths, between families of archaeal and bacterial inferred origin, are compared across the three major functional categories. While the eukaryotic branch lengths among the groups do not show significant differences, differences are detected in their respective stems (raw stem lengths and stem lengths). b, Archaeal and bacterial LECA families of similar selective pressures (as measured by dN/dS values across family members) differ significantly in terms of their raw stem lengths. Sets of families from both groups were matched with respect to their dN/dS values in the indicated reference species. The dN/dS data were downloaded from Ensembl for family members corresponding to Homo sapiens (Metazoa), Aspergillus nidulans (fungi) and Zea mays (plants) (see Supplementary Information section 1). The comparison of the raw stem lengths of the two sets shows that archaeal families generally have significantly longer stems (upper plots), and functions within the ‘information storage and processing’ category (lower plots), irrespective of their selective pressures. c, Archaeal and bacterial LECA families of similar connectivity/expression levels show significantly different raw stem lengths (see Supplementary Information section 1). In ac, differences between the archaeal and bacterial component were evaluated with a two-tailed Mann–Whitney U-test and the P value is indicated in each case (*P ≤ 5 × 10−2; ~ P ≤ 1 × 10−1; #P > 1).

  3. Extended Data Figure 3: Analysis of the cyanobacterial signal in primary plastid-bearing eukaryotes. (369 KB)

    a, Ring plot showing the distribution of inferred prokaryotic origins in widespread plant protein families, as in Extended Data Fig. 1a. The profile of inferred origins of eukaryotes that acquired a plastid through primary endosymbiosis carries a strong signal from the cyanobacterial endosymbiont. b, c, Families of inferred cyanobacterial origin have significantly shorter stem lengths and raw stem lengths than alphaproteobacterial families (b) and than the random distribution of stem lengths from the bacteria inferred component (c), pointing to a more recent acquisition of plastids (post-LECA). d, Overall, as with mitochondrial localized proteins, those proteins localized to plastids have shorter stems than the nuclear and endomembrane system proteins. e, Schematic representation of the expected difference in stems, given that cyanobacterial endosymbiosis occurred after the diversification of the major eukaryotic lineages. As confirmed, the raw stem lengths measured from plant protein families to their common ancestor with cyanobacteria are shorter than those whose origin can be traced back to Alphaproteobacteria or other bacterial groups. Two-tailed Mann–Whitney U-test P value symbols in b and d are as in Extended Data Fig. 1; additionally ****P ≤ 1 × 10−4; *****P ≤ 1 × 10−5.

  4. Extended Data Figure 4: Effect of alternative LECA definitions. (513 KB)

    a, The four eukaryotic groups including all 37 selected eukaryotic species used in the analysis are shown next to the NCBI taxonomic structure, with the higher groupings modified according to the Tree of Life Project (http://tolweb.org/Eukaryotes/3). b, Stricter LECA definitions have a much larger effect on the bacterial component than on the archaeal component, which is more widespread among eukaryotic groups. c, The effect of different LECA definitions in terms of taxonomic assignments and differences in stem lengths between proteins of alphaproteobacterial origins and those derived from other bacteria. Numbers in parenthesis indicate the total number of LECA families that passed the threshold. The kernel density plots, as in Fig. 2b, show the observed stem length means for Alphaproteobacteria compared with 106 random samplings among values in protein families of bacterial origin. The observed means (μobs) are shown with a dashed red line, reflecting the P value of each test, and indicated next to the plot. See also Supplementary Information section 3.1.

  5. Extended Data Figure 5: Alphaproteobacterial-derived proteins have consistently shorter branches, irrespective of the methods, data sets, and support thresholds. (240 KB)

    Kernel density plots of the random mean distributions of the stem lengths are shown for the different methods, data sets and support thresholds used (see also Supplementary Information sections 3.2 and 3.3). The observed alphaproteobacterial means (μobs) are as in Fig. 2b. a, Results after using either the phylogenetic trees provided by the authors in ref. 8 (upper left), our standard phylogenetic pipeline applied to their sampling of sequences (upper right) or alternative phylogenetic pipelines or samplings from EggNOG (lower). b, The main result is robust against progressively stricter support thresholds until the sample size becomes too small (support threshold > 0.9). Numbers in parenthesis indicate the number of bacteria-inferred LECA families for each threshold.

  6. Extended Data Figure 6: Evaluation of alternative HGT scenarios and other potential biases. (240 KB)

    a, The sampling effect was simulated by artificially removing part or all of the alphaproteobacterial sequences in the final data sets. To simulate the potential bias caused by an enriched sampling of Alphaproteobacteria, an artificial reduction of alphaproteobacterial sequences to 50% was applied to the data set (‘HALF alpha sampling’). The reduction of alphaproteobacterial sequences by 50% does not significantly change the inferred stem length within families of alphaproteobacterial origin. #Cases where the difference was not significant. b, Different scenarios of HGT to the proto-mitochondrion are unable to explain the observed signal in families mapped to non-alpha Bacteria. The transfer of a gene from Alphaproteobacteria to another bacterial lineage after mitochondrial endosymbiosis and its parallel loss from the lineage of the mitochondrial ancestor (‘post-mito HGT from alpha’) would result in unchanged stem lengths. Loss of a gene from the alphaproteobacterial sister clade would result in an increase of the inferred stem lengths (‘vertical transmission/pre-mito HGT from alpha’). The transfer of a gene from the protoeukaryotic lineage to other bacterial clades would result in shorter stem lengths compared with the alphaproteobacterial mappings (‘post-mito HGT from protoeukaryote’). c, Upon total exclusion of alphaproteobacterial sequences (‘NO alpha sampling’), eukaryotic families map to other bacterial groups but with stem length higher than those observed typically. The same is observed when comparing the stem lengths of the families mapping to proteobacterial groups in the absence of Alphaproteobacteria with those typically mapping to proteobacterial groups other than Alphaproteobacteria. d, Box plots showing that there are no significant differences in the stem lengths between alphaproteobacterial families with mitochondrial localization compared with those with other subcellular localizations (left), or between families involved in energy-related functions compared with those involved in other functional categories (right). e, Box plot showing no significant difference between the distribution of stem lengths of families of Rickettsiales-inferred origin and other Alphaproteobacteria. f, Alphaproteobacterial families in different functional categories show no difference in stem lengths. In all cases the distributions were compared using a two-sided Mann–Whitney U-test. See also Supplementary Information sections 4 and 5.

  7. Extended Data Figure 7: LECA inference and Lokiarchaeota. (231 KB)

    Results after the inclusion of Lokiarchaeota in our analysis. a, The distribution of the sister group inference among prokaryotic taxonomy is shown in a ring plot together with the number of families in each group in parentheses (as in Extended Data Fig. 1). b, Box plot showing the stem length profiles of the various prokaryotic groups. Lokiarchaeota show the lowest values among all archaeal groups but higher values than any bacterial group. The symbols correspond to the same P values explained in Extended Data Fig. 1 after applying a permutation test (106 permutations) for the archaeal and bacterial components, independently. c, Box plot with the comparison between the non-Loki archaeal, the Lokiarchaeota and the bacterial stem length profiles. The P value symbols are as before (two-sided Mann–Whitney U-test, correction for false discovery rate). d, Schematic representation of the effect of the absence of Lokiarchaeum sequences on the stem lengths. The inferred origin of 30 eukaryotic families that were previously mapped to other, mainly archaeal, groups within the eggNOG version 4 database, is Lokiarchaeota, when homologous sequences from this metagenome are included. A reduction in the observed stem lengths of the families of Lokiarchaeota-inferred origin is expected in the scenario of Lokiarchaeota being the closest known archaeal relative of Eukaryotes. See also Supplementary Information section 6.

  8. Extended Data Figure 8: Correspondence of different LECA components with different cellular localizations and functions (extended version of Fig. 3). (591 KB)

    ad, Different LECA components have different GO cellular components (a, c) and functional (b, d) profiles. Genes of different origin tend to have different functions and subcellular localizations. a, b, The same correspondence analysis symmetrical biplots as in Fig. 3 in higher resolution, with the names of the taxonomic group, the function and the GO slim terms indicated next to the coordinates. The percentage of variance explained by each principal component is indicated next to each axis in parentheses. c, d, The contingency tables also used in correspondence analysis are shown in the form of a heatmap. The asterisks in the different cells reflect the significance of the association between a given origin and a localization (c) or function (d), as computed using permutation tests (106 permutations), where the annotations among each eukaryotic family were reshuffled (see Methods). The correspondence between the symbols and the P values is as in Extended Data Figs 1 and 3. e, The COG functional categories, as organized in the three major groups ‘information storage and processing’, ‘cellular processes and signalling’ and ‘metabolism’.

Supplementary information

PDF files

  1. Supplementary Information (427 KB)

    This file contains Supplementary Notes, which comprise alternative methods and tests, and additional references.

Excel files

  1. Supplementary Table 1 (101 KB)

    The selected 37 eukaryotic species and the 692 prokaryotic taxonomic levels used for sub-sampling the eggNOG v4 orthologous groups.

  2. Supplementary Table 2 (304 KB)

    The file contains information on the protein families assigned to LECA, on which the subsequent analysis was performed. This includes information based on the phylogenetic inference (sister group, component assignment, branch length estimations) and the corresponding annotations, as provided by eggNOG v4 or as defined by the family's members.

Additional data